Table of Contents
ABSTRACT
This report describes the technical design process of Mass haul diagram together with analytical aspects of a 280-meter roadway area. Formation levels need to be calculated during this project together with cut and fill volume determination while Mass Haul Diagram report (MHD) development takes place. A vertical curve was incorporated into the standard-engineered longitudinal profile which received a 500-meter radius. Analysis of formation levels occurred at 20-meter intervals both in the current and proposed sections and calculations were performed using the average-end area approach. The cut and fill sections obey the specifications defined for Type 4 cross-sections. Medical administrators need to balance earthwork activities through applying a reduction factor of 0.85 to the volume of extracted materials.
INTRODUCTION
Roadway construction projects require earthwork design to function as a crucial civil engineering aspect. The document performs a detailed exploration of a 280-meter-long road profile to establish formation designs and quantify cut and fill volume measurements. A vertical curve incorporated at chainage 140 meters improves the elevation transition for the design alignment structure. The main goal of this project is to establish balanced earthwork (mass haul diagram report & longitudinal section) operations by utilizing resources efficiently while satisfying geometric road design standards.
BACKGROUND
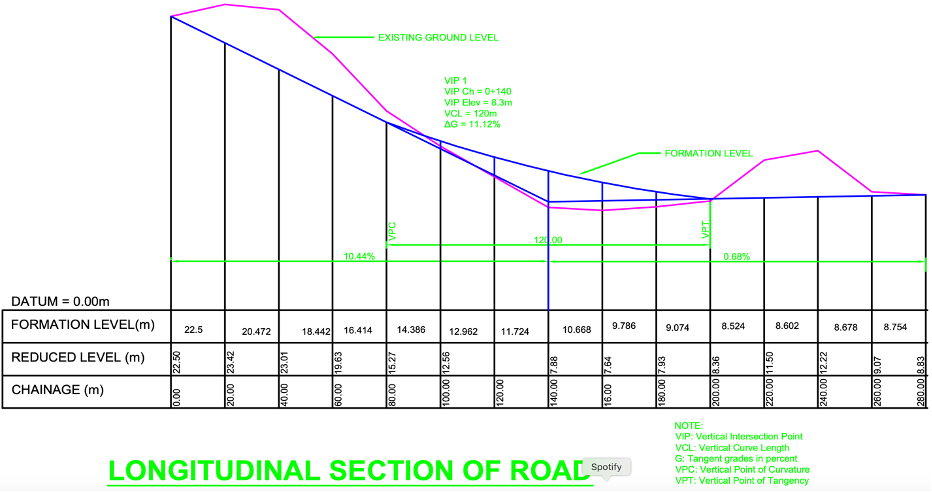
According to mass haul diagram report & longitudinal section project requirements all formation levels from chainage 0m to 280m must stay identical for both existing and proposed elements. The Vertical Intersection Point VIP1 receives a vertical curve at chainage 140m with a vertical elevation of 8.3m. The implemented vertical curve features a 500m radius running between chainage 80m at Point of Vertical Curvature and chainage 200m at Point of Vertical Tangency. The vertical curve extends across 120 meters through its vertical curve length (VCL).
The roadway undergoes a gradual transition because of this curve parameter system. The longitudinal section built in AutoCAD displays tangent grade designations (G) before and after the curve and shows these grades as 11.2%. The datum is set at 0.00m. The road profile used svertical scale ratios of 1:200 together with horizontal scale ratios of 1:1000 for its design. The implemented cross-section type uses Type 4 that consists of:
- Embankment (Fill): Top width = 18.50m, side slope width = 5.93m (left), 2.00m (right), height = 3.95m
- Cut: Top width = 18.50m, side slope = 2.00m on both sides, height = 3.95m
PROCEDURE
Longitudinal Profile Development:
A measurement of ground levels occurred every 20 meters from chainage 0m to 280m. The formation levels followed the ground levels at chainages 0m and 280m. The road receives a vertical curve at VIP1 (chainage 140m) with an elevation of 8.3m to achieve a steady slope gradient.
| Chainage (m) | Ground Level (m) | Formation Level (m) | G.L – F.L (m) | Operation |
| 0 | 22.50 | 22.50 | 0 | Neutral |
| 20 | 23.42 | 20.47 | +2.95 | Cut |
| 40 | 23.01 | 18.44 | +4.57 | Cut |
| c60 | 19.63 | 16.41 | +3.22 | Cut |
| 80 | 15.27 | 14.39 | +0.88 | Cut |
| 100 | 12.56 | 12.96 | -0.40 | Fill |
| 120 | 10.22 | 11.72 | -1.50 | Fill |
| 140 | 7.88 | 10.67 | -2.79 | Fill |
| 160 | 7.64 | 9.79 | -2.15 | Fill |
| 180 | 7.93 | 9.07 | -1.14 | Fill |
| 200 | 8.36 | 8.52 | -0.16 | Fill |
| 220 | 11.50 | 8.60 | +2.90 | Cut |
| 240 | 12.22 | 8.68 | +3.54 | Cut |
| 260 | 9.07 | 8.73 | +0.34 | Cut |
| 280 | 8.83 | 8.83 | 0 | Neutral |
Step-by-Step Procedure to Identify Cut and Fill:
1. Compare Formation Level (F.L) and Existing Ground Level (G.L)
At each chainage:
- If G.L > F.L → Cut (excavation needed)
- If F.L > G.L → Fill (embankment needed)
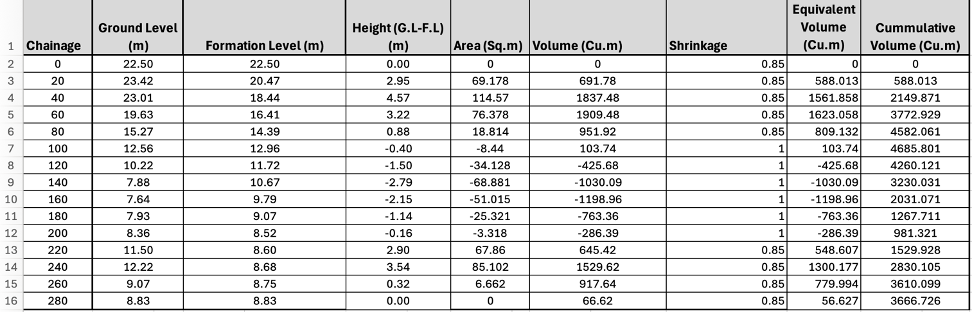
Data Tabulation:
The height of cut or fill determination required a calculation from the formation level by subtracting the ground level at each chainage. The Type 4 cross-section allowed computation of area calculations through height measurement.
Volume Calculation:
The Average-End Area Method calculated the volumes between each segment.
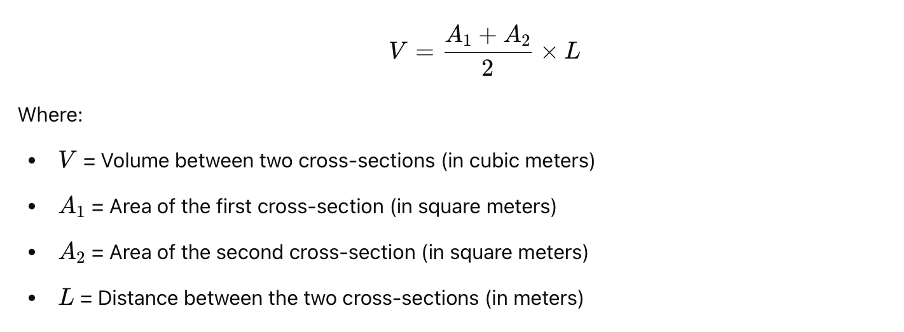
The calculation of equivalent volumes included multiplication of cut volumes by 0.85.
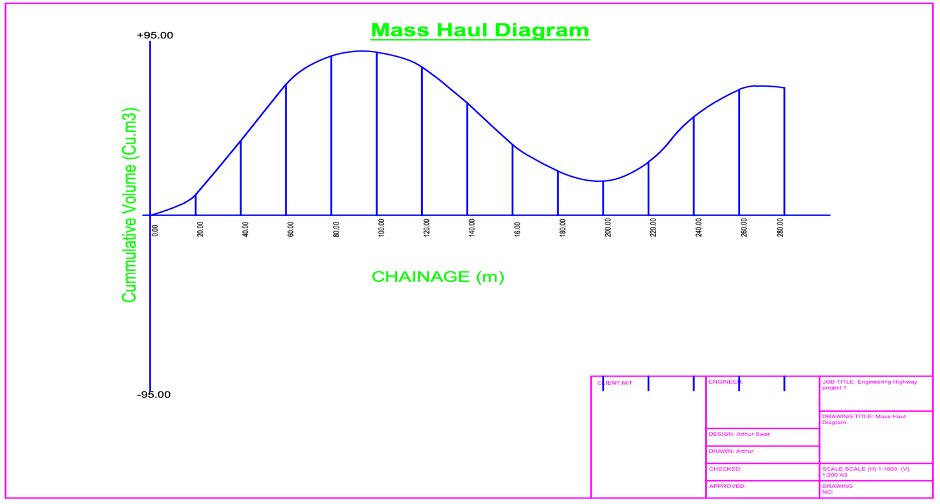
Cumulative Volume and Mass Haul Diagram report (MHD):
The plots of accumulated volumes against chainage served to describe earth movement. The MHD served as a tool to identify where borrow pits and spoil areas would be situated.
FINDINGS
The following key values were extracted from the longitudinal section:
Calculate the following.
(i) the height of cut/fill, (ii) areas, (iii) volumes, (iv) equivalent volumes, and (v) cumulative volumes for the various chainages
For Fill
If the Ground Level =23.42 and Formation Level=20.47
B1=18.5
B2=b1+(2.95/2*3.95/3.95) *2=21.45
Area1=29.46313m2
B1=25.45
B2=B1+(2.95/2*3.95/3.95) *2=28.4
Area2=(B1+B2)/2*(2.95/2) = 39.71438 m2
Total Area = Area1 + Area2 =69.1775 m2
For Cut
b1=18.5
b2=19.10051
Area1=(b1+b2)/2*(-0.4/2) =-3.76005m2
B1=b2+2+2=23.10051
B2=B1+(0.4/2*5.93/3.95) *2=23.70101
Area2=(B1+B2)/2*(-0.4/2) =-4.68015m2
Total Area= Area 1+ Area 2=-8.4402m2
The cut and fill areas across the alignment use the Type 4 cross-section design based on drawings in Figure 2. The design placement of cut to fill transition took place close to the vertical curves for achieving balance purposes.
Mass Haul Diagram report (MHD):
The MHD built from cumulative volume information shows a positive volume change in cut areas (0–80m and 220–260m) and negative volume change in fill sections (100–180m). The maximum cumulative structure appears during the last section of the cutting area just before entering the fill segment.
CONCLUSION: Mass haul Diagram report & Longitudinal section
The designed earthworks show successful balance of excavation with filling materials through correct alignment methods and curve configuration principles. Connection of vertical curves at chainage 280m together with matched formation levels at both ends reduced total earthwork amounts. The implementation of Type 4 cross-section design through every cutting and filling area simplified area and volume measurement calculations. Site operations became more efficient through the implementation of the shrinkage factor and mass haul diagram in addition to their use. The design follows standard road criteria together with a well-defined construction framework.
Latest assignment on Liquid limit test geotechnical engineering – 2025
Free college assignment about STANDARD PENETRATION TEST – 2025
Communication engineering assignment on ISAMBARD KINGDOM BRUNEL
Latest Multipurpose foldable table Assignment on auto cad-solid works design 2025
Longitudinal section and mass haul diagram report, Longitudinal section civil engineering report, Sketch the mass haul diagram assignment example, How to draw mass haul diagram in road design, Mass haul diagram with explanation and sketch, Longitudinal profile and mass haul diagram for road project, Mass haul diagram lab report or coursework, Mass haul diagram procedure and calculations, Sample report on longitudinal section and mass haul, Mass haul diagram road construction example with sketch