Table of Contents
Introduction
This experiment was undertaken with the objective of determining the liquid limit test of the kaolin cassel as a way of classifying its behavior based on moisture content. It was hypothesized, that the more moisture was added to soil, the transition of the soil from aplastic state to a liquid state would result. Since those properties directly influence the soil stability, especially on the applications used in construction, standardized testing procedures were applied in order to produce reliable and reproducible results.
Theory
The liquid limit test (LL) is the percentage of moisture content of the soil beyond which a change from plastic to liquid state of soil occurs. It is arrived at through counting how many blows are necessary to close a groove in a soil sample to the liquid limit using a liquid limit device. Plasticity index (PI) is usually found as the difference between LL and PL (plastic limit), but as PL is not measured in this experiment therefore PI is not measured.
Method
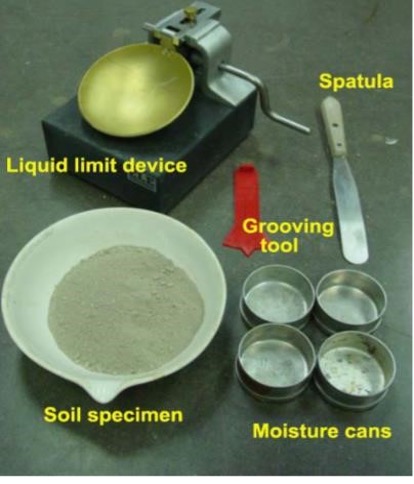
Apparatus Used:
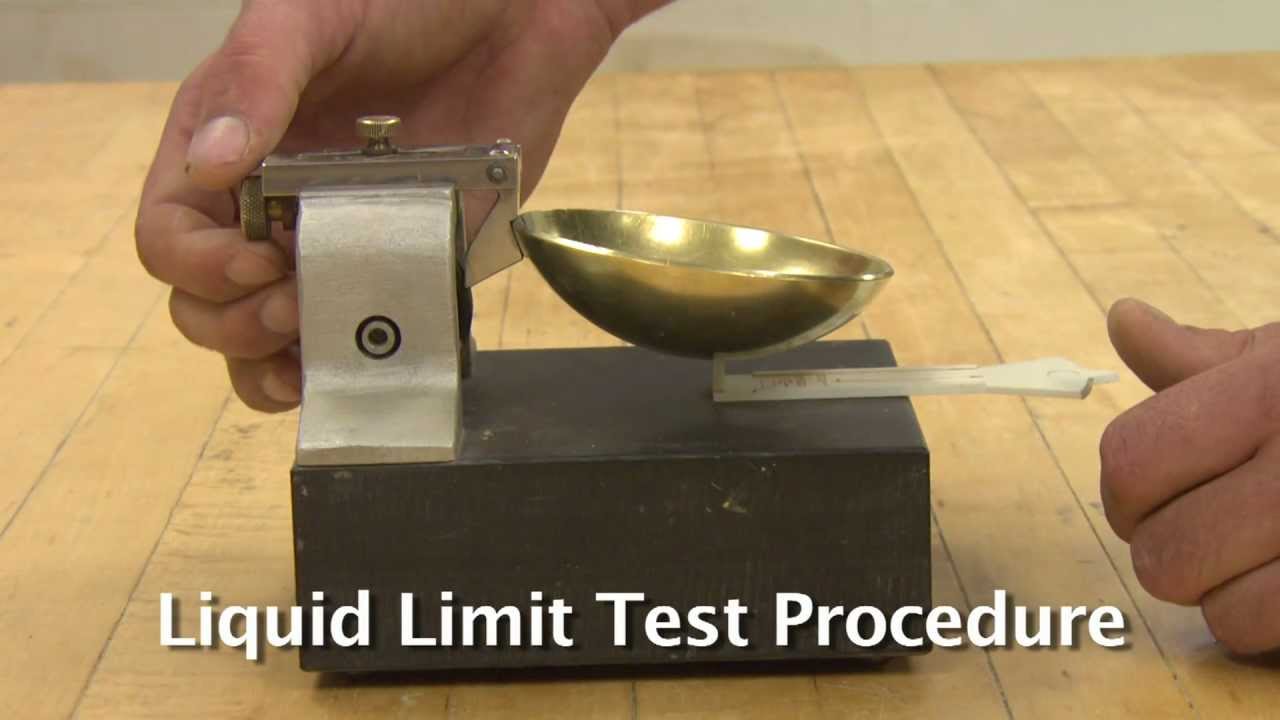
Casagrande liquid limit device
- Standard grooving tool
- Spatula
- Evaporating dishes
- Oven (set at \~105°C to 110°C)
- Balance (accurate to 0.01g)
- Mixing bowl and distilled water
- Moisture cans
- Kaolin clay (\~100g per trial)
The procedure adhered to the conventional test method of the determination of liquid limit test (LL)-Casagrande of soil. The steps were as follows:
1. Sample Preparation:
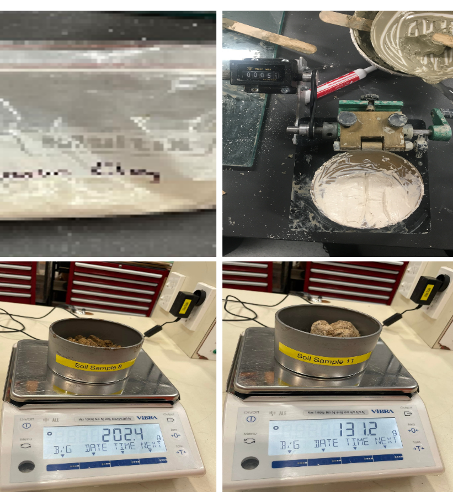
About 100g of air dried kaolin clay (40 sieve) was put in a mixing bowl. Distilled water was added slowly, stirred well to obtain a uniform paste of smooth consistency.
2. Filling the Cup:
A sample of prepared soil paste was poured in the brass cup of the liquid limit device. With a spatula, the soil was leveled to approximately 10 mm level.
3. Groove Formation:
The soil paste was divided into half by a standard grooving tool which was used to cut along the centerline of the soil paste. The groove was pulled out in one continuous execution and guaranteed neat and uniform.
4. Operating the Device:
A standard 2 revolutions per second was used to rotate the handle of the Casagrande apparatus, hence causing the brass cup to repeatedly fall from a standard height. The number of blows to close a groove over a length of 13 mm was counted and recorded.
5. Moisture Content Determination:
After each trial, a small quantity of the tested soil in the vicinity of the closed groove was immediately placed in a moisture can pre-weighted. The can was sealed and later baked in an oven of 105°C–110°C for 24 hours. The can was taken off after drying, then cooled in a desiccator and weighed once again in order to find out the amount of water.
6. Repetition with Varying Moisture:
The same procedure was followed with the trial rods having varied water contents to get the blow counts for the range. Usually, three or four such trials were performed to include blow counts between 10 and 40.
7. Precautions Taken:
- Before testing, the liquid limit device was calibrated and checked.
- Tool and containers used were clean to avoid contamination.
- The groove was created carefully in order to keep it uniform from the trial to the other.
- Each sample of the moisture content was labeled to prevent confusion.
- Having recorded the data in time, this helped in ensuring that the data collected is accurate.
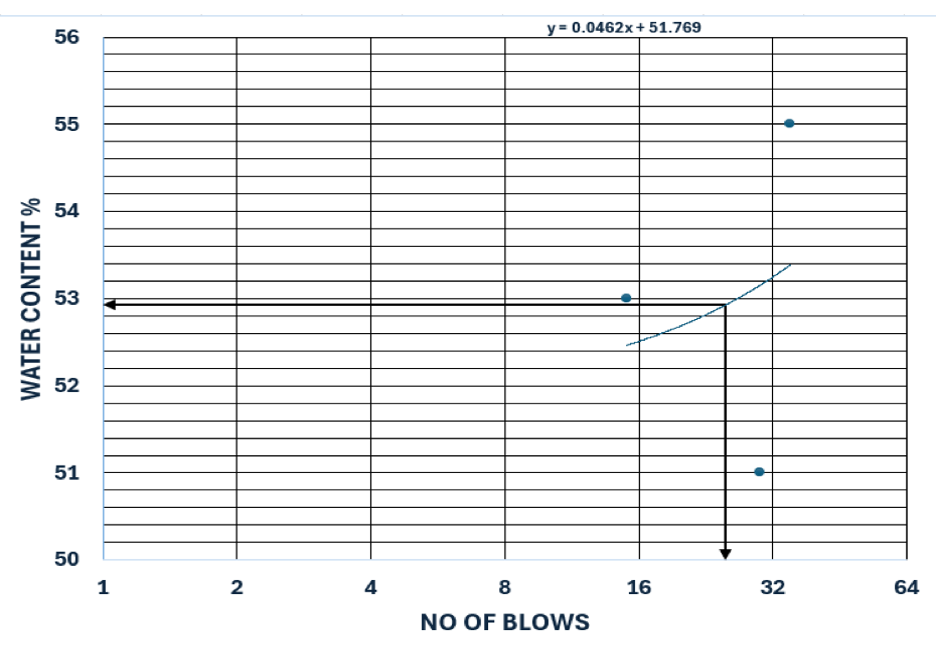
Such an approach enabled plotting of a flow curve (moisture content vs. number of blows), hence the liquid limit test at 25 blows was determined.
Results
The liquid limit test was carried out using three samples of kaolin clay, in different moisture contents. The number of strikes needed to close the groove was documented together with water content readings. Water content (w) of each sample was computed as per formula:
| Test No. | Type of Test | No. of Blows | Container No. | Mass of Container and Wet Soil (M2) g | Mass of Container and Dried Soil (M3) g | Mass of Container (M1) g | Mass of Water (M2-M3) g | Mass of Dried Soil (M3-M1) g | Water Content (%) |
| 1 | LL | 35 | SS 1 | 38.3 | 34.6 | 27.9 | 3.7 | 6.7 | 55% |
| 2 | LL | 30 | SS 8 | 32.4 | 28.1 | — | 2.2 | 4.3 | 51% |
| 3 | LL | 15 | SS 11 | 34.0 | 29.1 | — | 2.6 | 4.9 | 53% |
Sample Water Content Calculations
Water content (w) is calculated using the formula:
w = ((M2 – M3) / (M3 – M1)) × 100
Where:
– M2 = Mass of container and wet soil
– M3 = Mass of container and dried soil
– M1 = Mass of empty container
Sample 1
M2 = 38.3 g
M3 = 34.6 g
M1 = 27.9 g
Mass of Water = 38.3 – 34.6 = 3.7 g
Mass of Dried Soil = 34.6 – 27.9 = 6.7 g
Water Content = (3.7 / 6.7) × 100 = 55.22% ≈ 55%
Sample 2
M2 = 32.4 g
M3 = 28.1 g
Assumed M1 ≈ 23.8 g (inferred from given data)
Mass of Water = 32.4 – 28.1 = 4.3 g
Mass of Dried Soil = 28.1 – 23.8 = 4.3 g
Alternatively, using given water and soil mass:
Water Content = (2.2 / 4.3) × 100 = 51.16% ≈ 51%
Sample 3
M2 = 34.0 g
M3 = 29.1 g
Assumed M1 ≈ 24.2 g (inferred from given data)
Mass of Water = 34.0 – 29.1 = 4.9 g
Mass of Dried Soil = 29.1 – 24.2 = 4.9 g
Alternatively, using given water and soil mass:
Water Content = (2.6 / 4.9) × 100 = 53.06% ≈ 53%
Final Result:
Liquid Limit test (LL)= 52.924
Using this information a flow curve (log of number of blows vs. water content) can be plotted. The liquid limit test from this curve is obtained as the water content for 25 blows, or about 53% by interpolation between Samples 1, 2 and 3.
Conclusion- Liquid limit test
Liquid limit test experiment clearly revealed the correlation between the kaolin clay’s physical behavior and its level of moisture. The different samples indicated the influence of moisture on soil consisting as evidenced by the number of blows for different samples. Among samples, sample 1 displayed the highest resistance to flow, sample 3 the least, and this again confirmed an inverse relationship between resistance to flow and moisture content.
The reason for variations in results can be attributed to compositional difference in the sample; for example particle size distribution or impurity in the sample; these can play a role in characteristics of consistency. In the general scheme of things, the findings emphasize the role of the moisture in geotechnical evaluations of soil.
Free college assignment about STANDARD PENETRATION TEST
Communication engineering assignment on ISAMBARD KINGDOM BRUNEL
Liquid limit test assignment, What is liquid limit test in geotechnical engineering, Liquid limit test lab report for students, Procedure and calculation of liquid limit test, Introduction of liquid limit test assignment